Mission: MOB Alert - North Atlantic
Last known position and time: 53.5°, -32.0° at 2026-03-15 23:19 UTC.
Modeled result: You get a steady southeastward open-water drift forecast with no shoreline contact inside the mission window, and finished outputs in under 3 minutes.
Why fleet operators search for man overboard drift forecasting
After a man overboard alert, you need to know where to search first, how fast the search area is expanding, and when the forecast should be updated. That is the practical job drift forecasting needs to do.
The value shows up across the whole workflow: your first search decision, the offshore coordination window, and the post-incident review used for insurers, P&I clubs, and internal safety reporting.
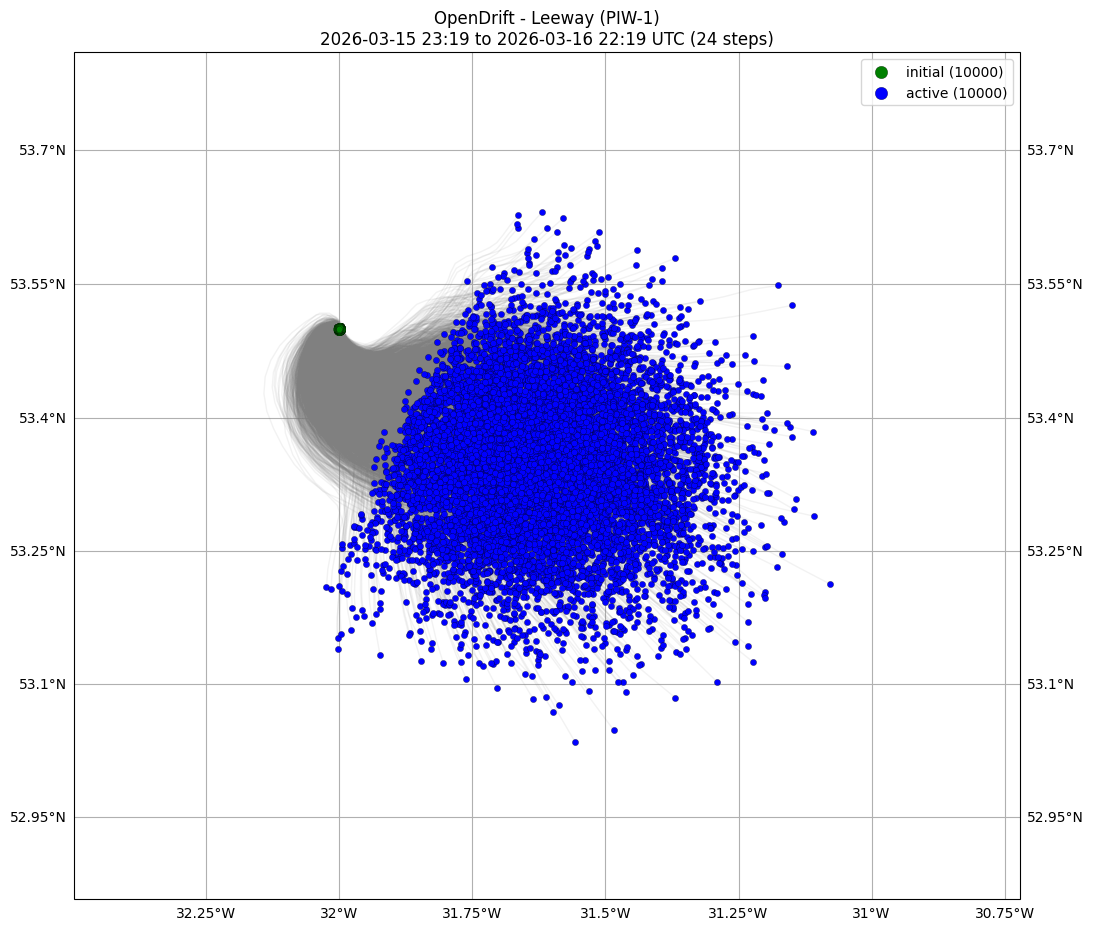
This run used a person-in-water object with 10,000 particles, launched from 53.5°, -32.0° with a 24-hour forecast request and completed in under 3 minutes.
You can use the final 50% and 90% probability areas to define the core search region and the wider uncertainty envelope for incident command.
The final centroid sits at 53.348221, -31.617745 with no modeled shoreline impact inside the mission horizon, so your response stays focused offshore.
What your team gets in the first 3 minutes
A probable search area
You move from a last known position to a defensible search geometry instead of relying on a single drifting point.
A shared operational picture
Your bridge team, shore operations staff, and external responders can work from the same forecast and the same assumptions.
A usable report and figures
You get maps, time-slice outputs, and a downloadable PDF that can be shared immediately and kept for later review.
A repeatable workflow
You can rerun the forecast as new information arrives and keep the response aligned with the latest search picture.
How fleet operators use man overboard drift forecasts
Immediate maritime search planning
Run a forecast as soon as your bridge or shore team has a last known position and time. Use the result to brief search assets, standby vessels, and external SAR partners.
Offshore crew recovery
Use the 50% and 90% search envelopes to organize offshore crew recovery when the incident is far from land and uncertainty expands quickly.
Vessel drift prediction and support craft
Apply the same workflow to disabled vessels, adrift tenders, rafts, and other support craft when you need vessel drift prediction, not only MOB response.
Post-incident review
Use the same mission outputs for incident review, due-diligence documentation, and discussions with insurers or legal teams.
North Atlantic man overboard drift forecast example
This example uses a North Atlantic man overboard scenario modeled in AldaDrift. The forecast began at 53.5°N, 32.0°W on March 15, 2026 at 23:19 UTC, tracked a person in the water for roughly 24 hours, and produced finished outputs in under 3 minutes.
In practical terms, the ensemble drifts steadily southeast, the search envelope expands from near-field to broad-area coverage, and no shoreline interaction is indicated within the horizon. That means you can keep the response focused on open-water search planning rather than diverting effort toward shoreline impact. If you want the broader platform context, you can also review the main AldaDrift landing page.
Launch
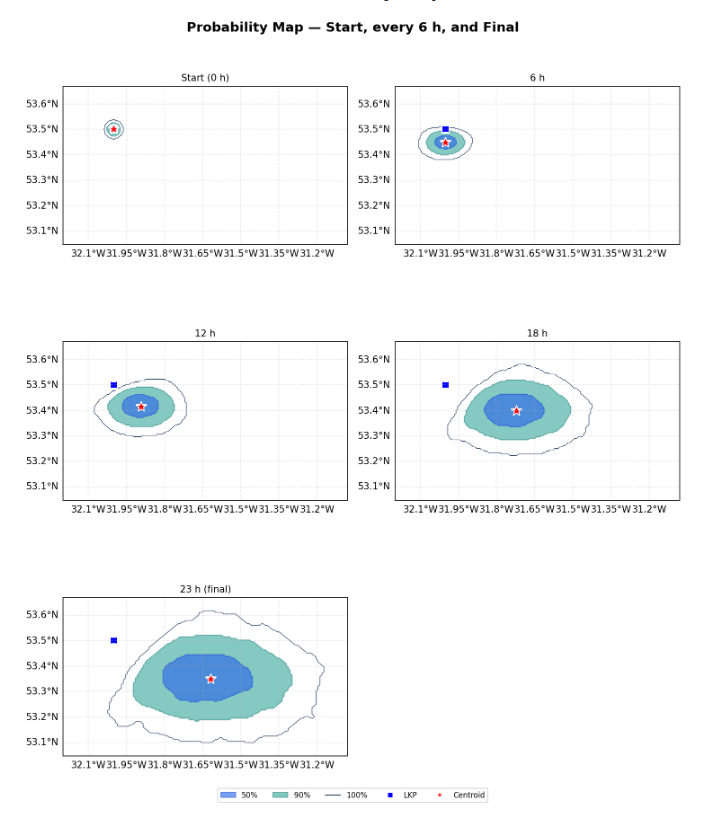
You start with a last known position at 53.5°, -32.0° at 2026-03-15 23:19 UTC and an initial uncertainty radius of 100 m.
6 hours
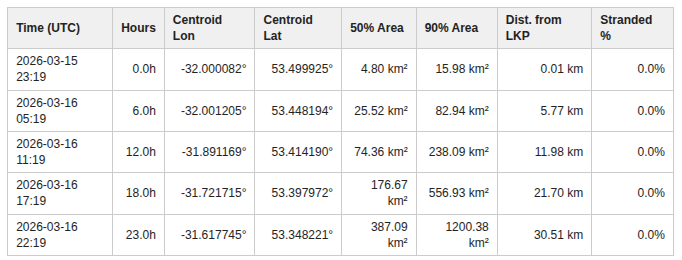
By 6 hours, the centroid is 5.77 km from the last known position and the 90% area has expanded to 82.94 km², enough to justify a structured widening of the offshore search.
12 to 18 hours
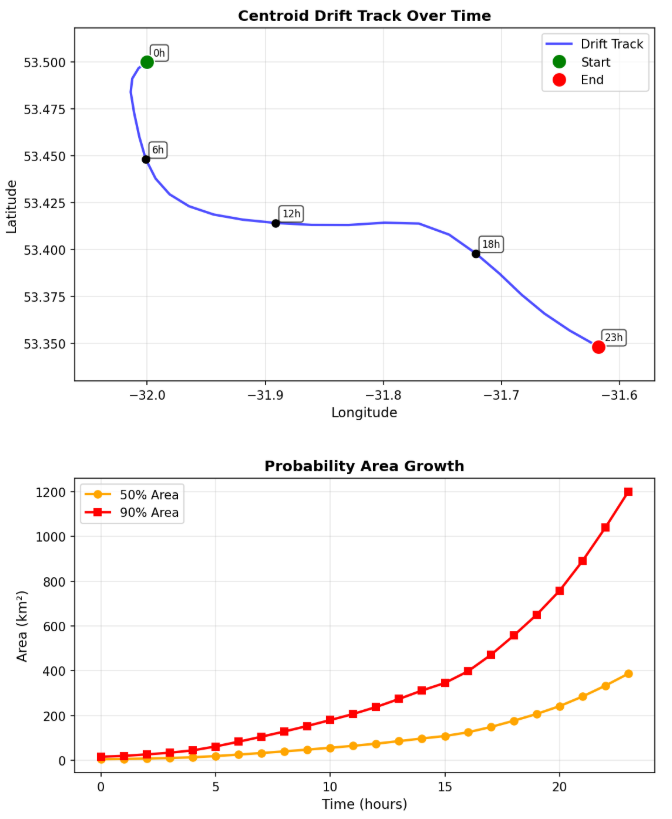
From 12 to 18 hours, the mission footprint grows from 238.09 km² to 556.93 km² in the 90% contour, while the centroid continues a consistent southeastward track rather than fragmenting into multiple competing outcomes.
23 hours
By 23 hours, the final centroid reaches 53.348221, -31.617745 after 30.51 km of drift at a mean direction of 123.5° True, with zero modeled stranding.
Outputs fleet teams can use for search planning
- Probability contours You get a final 50% area of 387.09 km² and a final 90% area of 1200.38 km², which is exactly the kind of geometry you need for search-area definition.
- Operational report The downloadable PDF gives your operations, safety, and management teams the same summary of drift distance, direction, centroid, and time-slice expansion.
- GIS-ready exports The report appendix includes audit-ready polygon coordinates, and AldaDrift supports GIS and raw-data workflows when you need deeper analysis.
Mission outputs from a modeled man overboard drift forecast
These assets come directly from the mission and show what your team can review, share, and use during an offshore response.
Report figures
Actual mission figures from MOB Alert - North Atlantic.
For fleet software teams, not just analysts
If you already run a fleet platform, safety dashboard, or incident workflow, the value is not limited to the web interface. You can create a mission programmatically, poll for completion, and pull down the files or contours your own system needs.
If you need integration, repeatable workflows, or organization-level access, review the drift forecasting API and the Operator plan.
Frequently asked questions
Is this page based on a real incident?
No. It uses a modeled North Atlantic MOB scenario generated in AldaDrift. The report and figures come from that scenario, not from a public reconstruction of a confirmed event.
What does this mission show?
A 24-hour North Atlantic person-in-water forecast with a steady southeastward drift, a final centroid at 53.348221, -31.617745, no shoreline contact during the mission window, and finished outputs generated in under 3 minutes.
Why is that useful for fleet operators?
Because it turns a last known position into a defensible offshore search geometry, shows how uncertainty grows over time, and creates a reportable audit trail for operations and post-incident review.